
Canva: Introducing world-leading data visualisation

Two years ago, Flourish joined the Canva family, and since then has been working to integrate its world-leading data visualisation technology across Canva’s Visual Suite.
In today’s data-driven world, data storytelling has emerged as a crucial element in making sense of the ever-expanding pool of information. Canva recognises the significance of bringing data to life in a captivating and easily understandable way, particularly in the Visual Economy era.
Canva is thrilled to have Flourish, a London-based company, leading the charge in the data visualisation space. Flourish’s exceptional platform has garnered a user base of over 1.5 million individuals worldwide, empowering them to distill complex data into visually stunning and interactive visualisations. The integration of Flourish into the Canva family, following the acquisition in 2021, was a natural step forward in Canva’s mission to empower individuals worldwide with powerful design capabilities.
Over the past few months, Canva has rigorously tested this technology through the Flourish app, which is available via Canva’s app store. Users have been able to create engaging data-driven presentations and reports, exploring the immense potential of this innovative tool.
This marks an exciting milestone in the journey of Canva and Flourish. Canva is proud to announce the launch of interactive data visualization charts within the Canva editor, further amplifying the creative possibilities. This integration ushers in a new era of dynamic and captivating visual communication. Prepare to take your designs to unprecedented heights with Canva’s interactive data visualisation capabilities at your disposal.
Effortlessly bring data to life
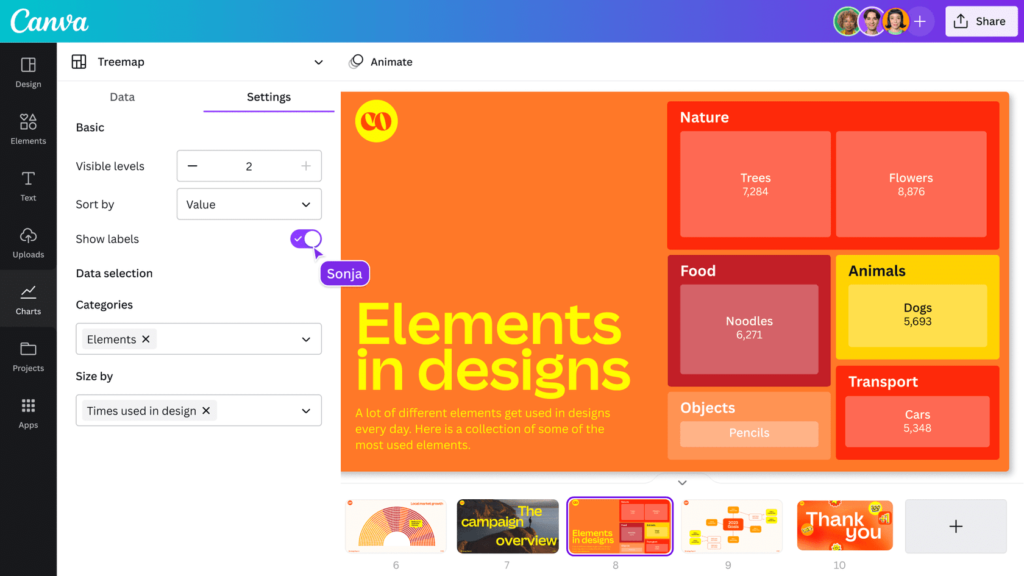
The initial release includes two captivating chart types: hierarchical treemap and packed circle charts. These features will begin rolling out today and will be accessible to Canva’s extensive user base of over 135 million monthly users by September. Alongside these additions, users can expect a wide range of other rich data storytelling features to enhance their design experience.
Both treemaps and packed circle charts offer engaging and easily digestible ways to present information across multiple categories. With just a few clicks, users can zoom in and out, as well as group data in various ways, adding an element of interactive exploration to their designs. These features bring a sense of excitement and playfulness to data visualisation, enabling users to create visually captivating representations effortlessly.
Aligned with Canva’s mission to empower individuals worldwide with design capabilities, the Flourish team shares a similar vision of empowering everyone to tell compelling stories through data. Their efforts revolve around making previously complex and inaccessible software accessible to all.
With Flourish charts, there is no requirement for coding knowledge or professional design expertise. Every member of your team can effortlessly transform their data into vibrant and interactive content, leveraging the power of Canva’s Visual Suite. By selecting a template and seamlessly integrating it into any Canva design, users can input their dataset with ease. Whether it’s uploading a spreadsheet, connecting to a live data source, or utilizing API integration, the process is straightforward and user-friendly. With Flourish and Canva working together, unlocking the potential of data-driven storytelling has never been more accessible.

Tell impactful stories
Data visualisations have become increasingly prevalent across various platforms, from social media graphics to sales and marketing materials, as well as internal communications. They play a pivotal role in conveying information effectively. The significance of data storytelling has soared, with applications ranging from creating global vaccination heatmaps to illustrating the impact of climate change. Even large corporations rely on data visualisations to curate winning financial presentations.
Recognising this growing importance, Canva is committed to empowering millions of users by integrating visualisation tools directly into its platform. By doing so, Canva enables users to communicate their data in more compelling, engaging, and visually captivating ways. Whether it’s unveiling intricate patterns, showcasing key trends, or simplifying complex information, Canva equips users with the tools needed to transform raw data into meaningful and impactful visual narratives. Embrace the power of data storytelling and unleash your creativity with Canva’s native visualisation capabilities.
Findings from the Canva Visual Economy Report highlight the widespread adoption of data visualisations among global business leaders. An impressive 86% of these leaders turn to data visualisations when developing plans and presentations, recognising their power in conveying information effectively. Additionally, a staggering 91% utilise data visualisations at least once a week, demonstrating their integral role in decision-making and communication.
Teams of all sizes have embraced the Flourish platform, leveraging its capabilities to transform complex datasets into accessible and captivating visualisations. Flourish’s technology has garnered trust from renowned organizations such as the BBC and Deloitte, serving as a go-to solution for seamless embeds, agency-quality graphics, compelling presentations, and engaging social media content. With Flourish, users can effortlessly elevate their visual storytelling, captivate their audience, and unlock the true potential of their data.
Building for the future
The integration of Flourish visualisations into the Canva editor brings an exciting development, making these powerful tools accessible to a wider audience. By seamlessly combining the strengths of both platforms, users of all backgrounds can now leverage these capabilities to create visually compelling content.
Looking ahead to 2023 and beyond, Canva remains committed to enhancing its platform with even more advanced features. This commitment extends to expanding its presence in the United Kingdom and Europe, with the aim of further strengthening the technical capabilities of the platform. By doing so, Canva empowers its vibrant community to share data in increasingly creative and captivating ways.
Ready to elevate your data storytelling game?
Don’t miss out on this opportunity to stand out from the competition. Contact us and let’s embark on a journey of data-driven creativity together!
(source: https://www.canva.com/newsroom/news/flourish-integration/)